Platform Intelligence — Ask Keel Anything
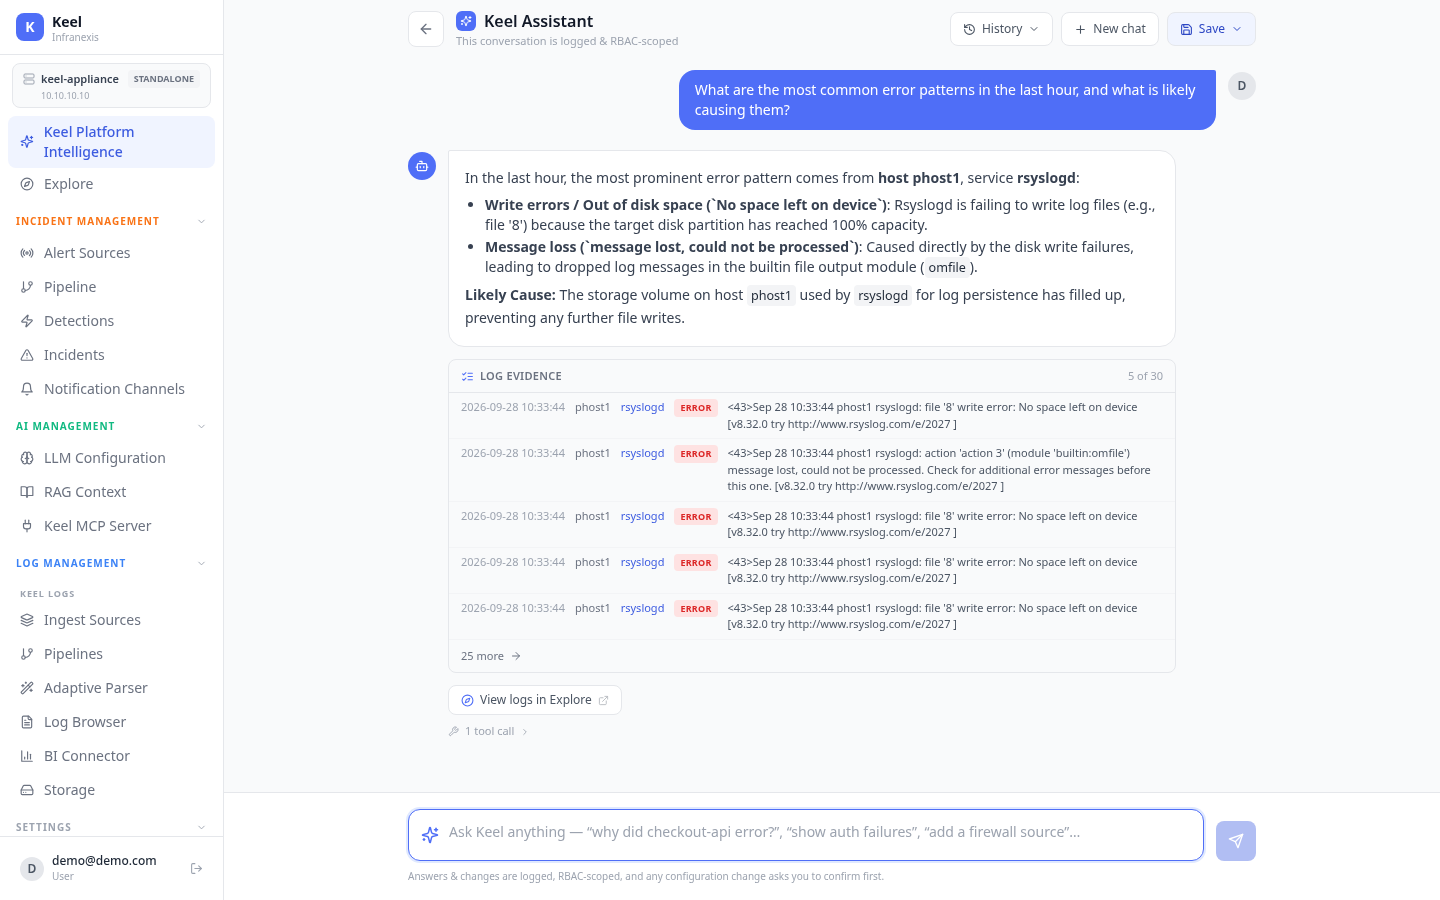
Location in Keel: /home (the landing page after sign-in)
Platform Intelligence is Keel's home screen and its primary interface: a plain-English console for your logs. Instead of learning a query language, you ask — "why did checkout-api error?", "show auth failures in the last hour", "add a firewall source" — and Keel investigates, answers, and (with your confirmation) can make the change. Every answer is grounded in your actual logs: as above, Keel identifies the pattern, gives a likely cause, and shows the log lines it used as evidence.
The briefing
Each time you sign in, the Keel Assistant gives you a short briefing: what changed since your last visit, open incidents and their likely causes, ingest and parsing health, and patterns that nothing has flagged yet — for example, a spike of error-level logs that no detection rule matches. Each item has an Ask action that opens the assistant already focused on that topic.
The briefing needs a configured model
The briefing and every AI answer run against the model you set in LLM Configuration. If no model is reachable, Keel still shows a status-only briefing (counts and health) and the rest of the platform works normally — you just don't get AI answers until a model is configured.
Asking questions
Type a question in the Ask Keel anything bar in plain English. Keel translates it, runs the work, and shows the answer along with the underlying data as proof. Suggested prompts get you started:
- Show me error logs for the last hour
- Summarize open incidents and likely causes
- Add a new log source
- Create a detection rule for failed logins
The assistant can both investigate (search logs, look up incidents, check the appliance) and act (create a source, draft a detection rule, change configuration).
Every change asks first
Answers and changes are logged and RBAC-scoped, and any configuration change asks you to confirm before it is applied. The assistant never changes your system silently, and it can only do what your role already permits. (Agents connected through the MCP server are stricter still — read-only.)
Status at a glance
Below the briefing, live tiles show the numbers that matter: open incidents, current EPS ingest rate (and dropped count), sources health, and detections active in the last 24 hours. Quick-jump chips — Incident Management, AI Management, Log Management, Settings — take you to the matching areas of the platform.
Related
- Explore & dashboards — curated dashboards and Dynamic Charts with AI
- LLM Configuration — choose the model that powers the assistant
- Incidents & root-cause analysis
- Keel MCP Server — connect your own AI agents (read-only)