Log Browser & Search
Location in Keel: /logs
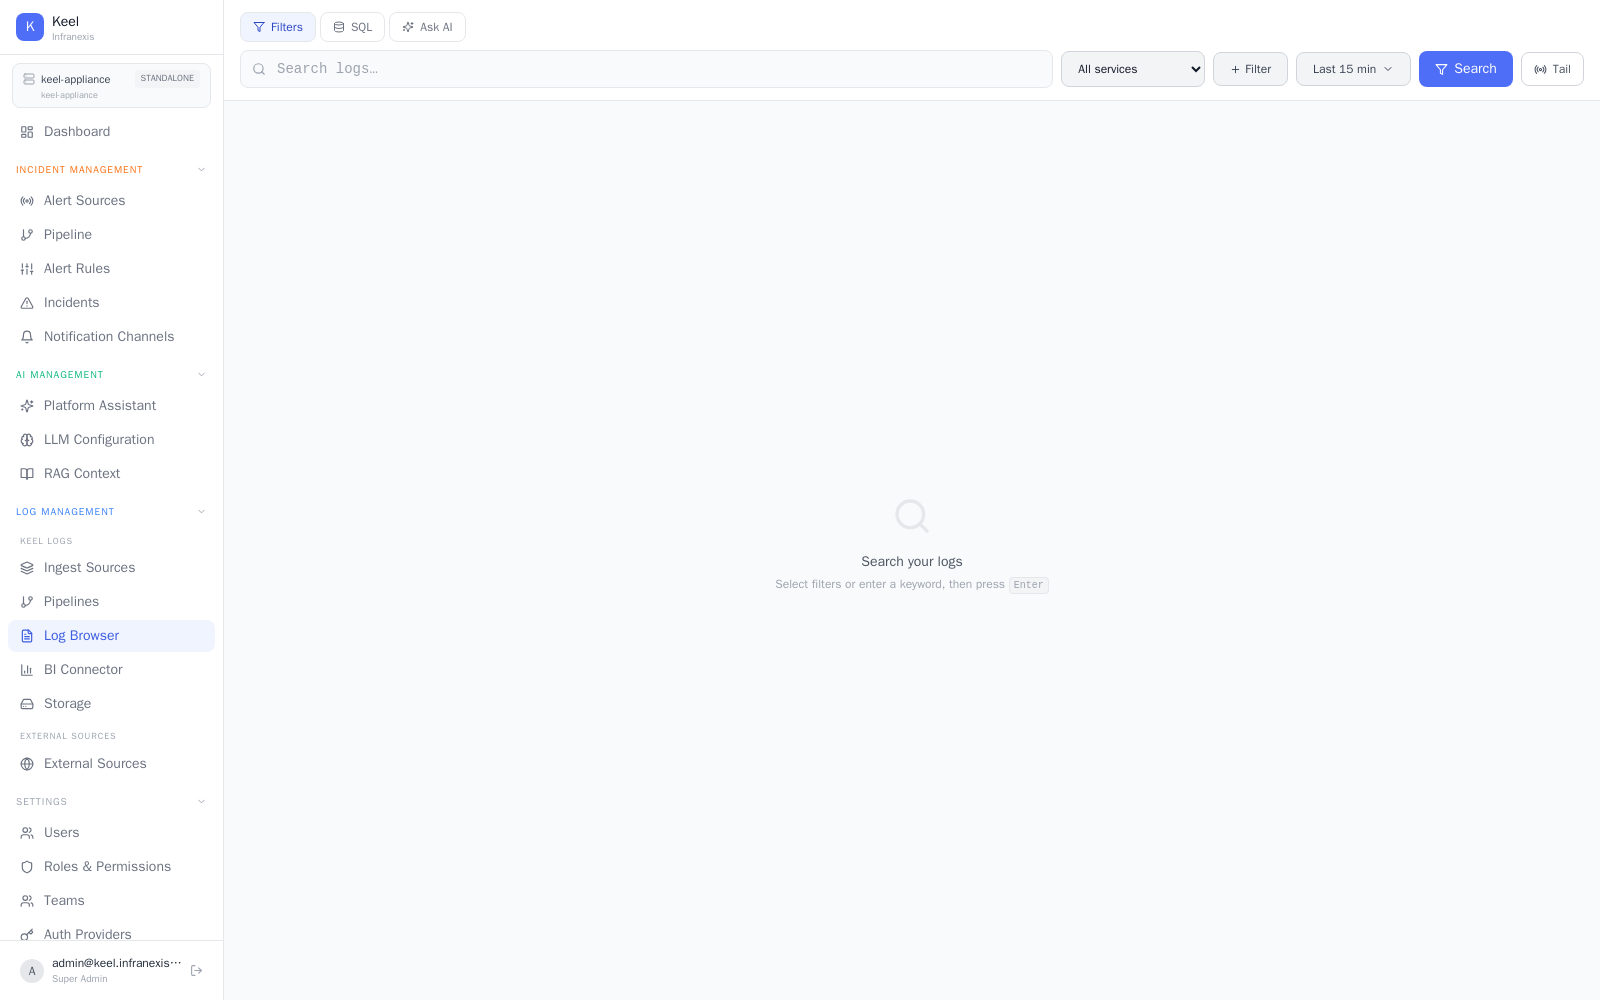
The Log Browser is where you read your logs. Pick filters or type a keyword to search, switch to a read-only SQL mode when you need it, or ask in plain English — and stream new logs live with Tail.
Searching
Type in the Search logs… bar and press Enter, or use Filters to narrow the results first. The service picker scopes the view to one or more sources — All services, or individual services such as shop-api, nginx-shop-access, postgres, sshd, or kernel. The time range control defaults to the last 15 min; change it to widen or narrow the window.
The empty state sums it up: select filters or enter a keyword, then press Enter.
SQL mode
Switch to SQL to run a query directly against the log store. This mode is read-only — built for power users who want precise, ad-hoc queries without leaving the browser.
Note
SQL mode is read-only by design. It is for reading and investigating logs, not for changing them.
Ask AI
Choose Ask AI to ask a question in plain English instead of building a query by hand — Keel translates it, runs the work, and shows the results. Analyze runs Keel's investigation over the current view.
AI features need a configured model
Ask AI and Analyze run against the model set in LLM Configuration. Filtering, SQL, and live tail work without a model — you just won't get AI answers until one is reachable. With a local model configured, nothing leaves your network.
Related
- Log Pipelines & Processing — parse fields so search is more precise
- Ingest Sources — where the logs come from
- Platform Intelligence — ask your logs anything from the home screen