Explore & Dashboards
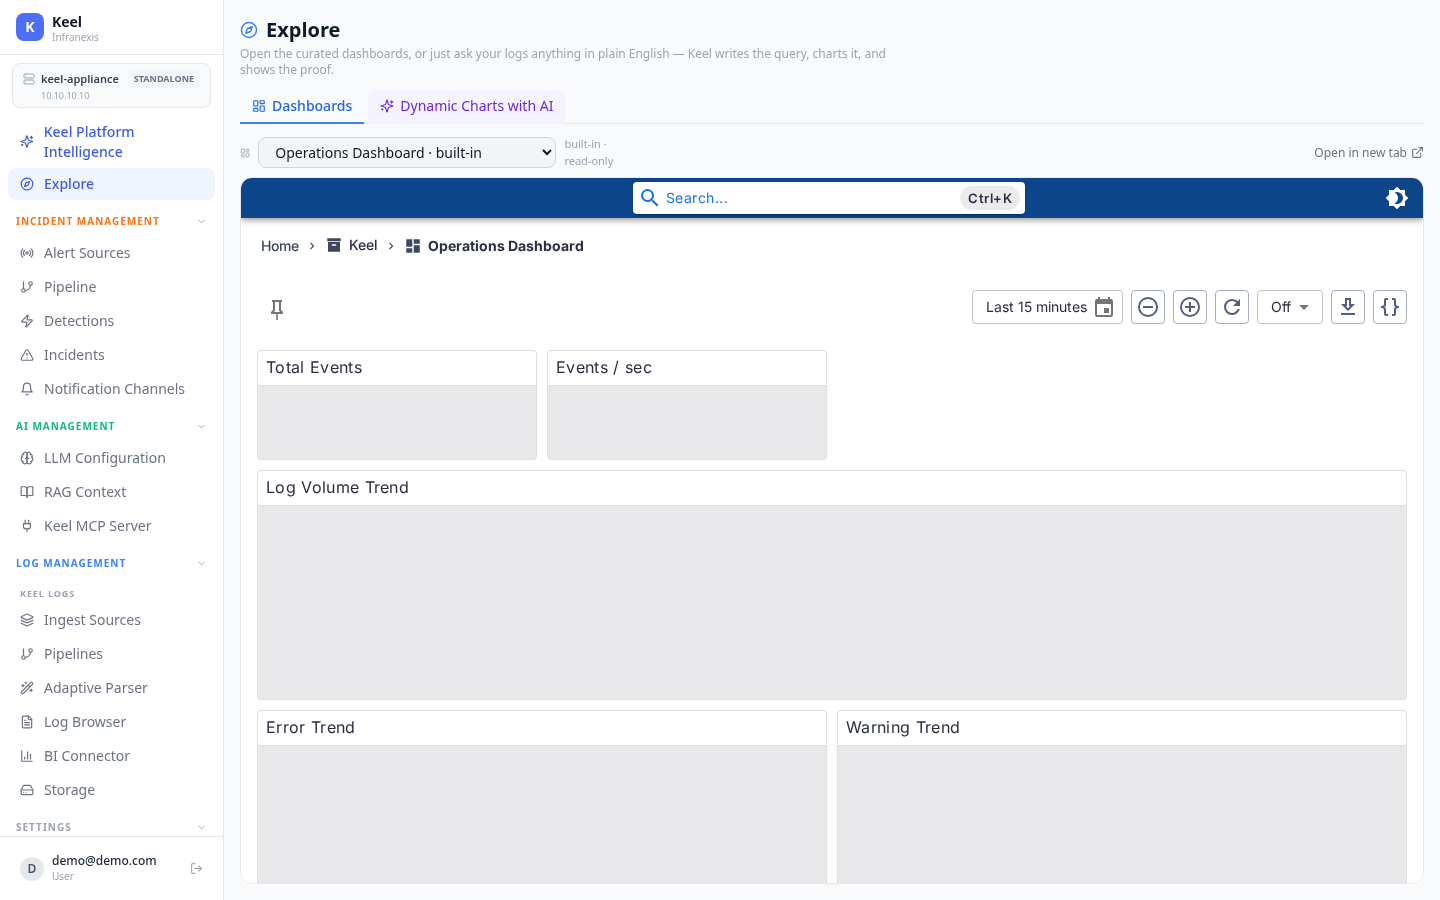
Location in Keel: /explore
Explore is where you visualize your log data. Open a curated dashboard for an at-a-glance view, or just ask your logs a question in plain English — Keel writes the query, charts the answer, and shows the underlying rows as proof.
Dashboards
Keel ships built-in, read-only dashboards you can open with one click:
- Log Overview — overall volume and activity.
- Errors & Warnings — error and warning trends.
- Operations Dashboard — operational health signals.
- Sources & Services — activity broken down by source and service.
Built-in dashboards open in a new tab and are read-only, so they're always a reliable baseline.
Dynamic Charts with AI
Switch to Dynamic Charts with AI and ask a question — for example "error count by service over the last hour." Keel translates it into a query, runs it, and renders the result as a chart alongside the data table it used, so you can verify the answer.
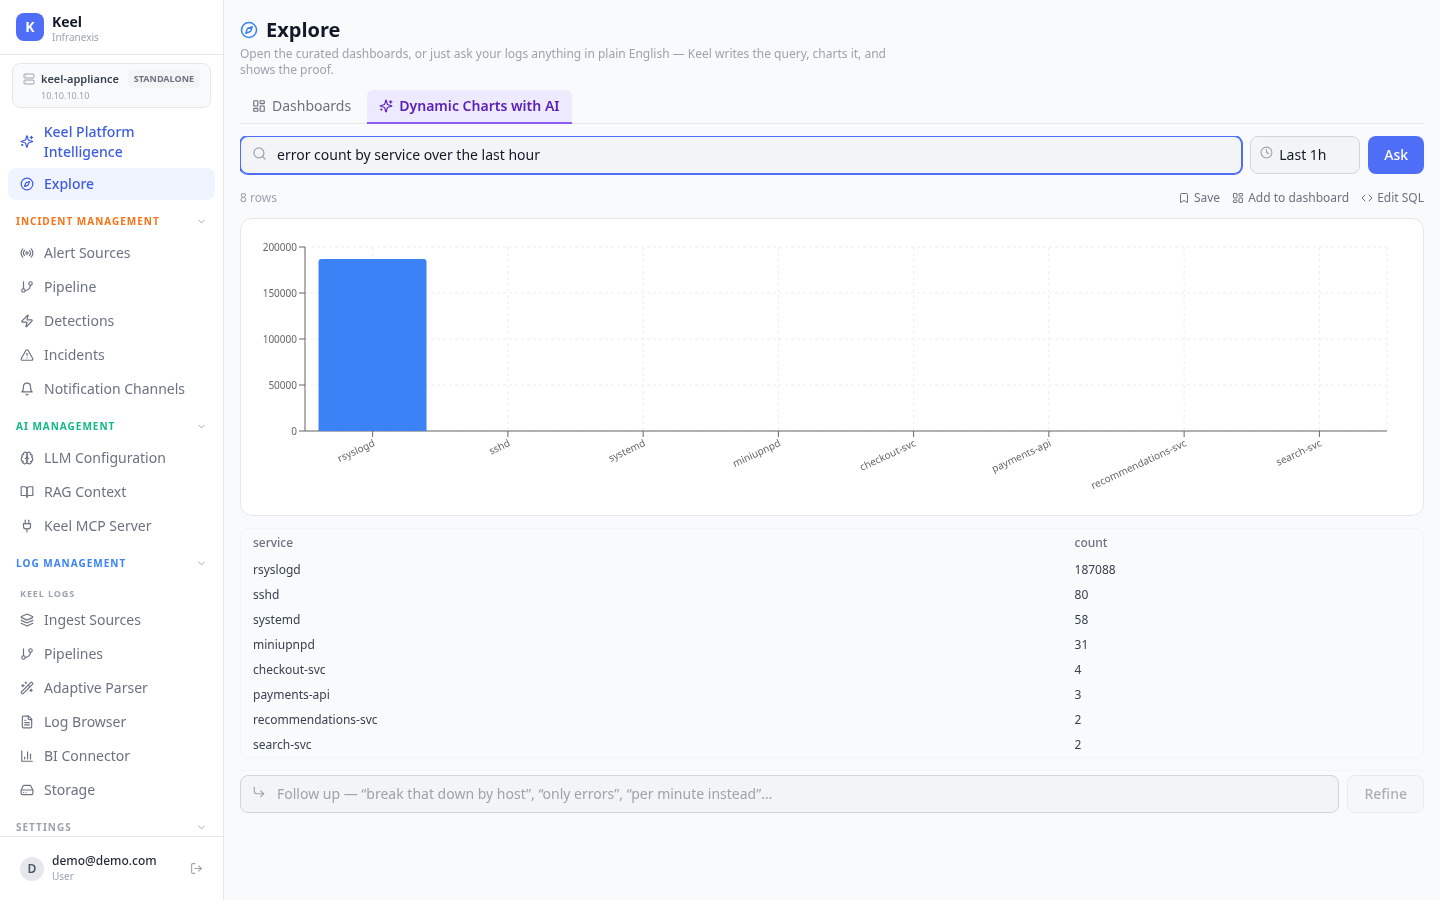
From there you can Save the query, Add to dashboard to pin it, or Edit SQL to take over the generated query directly. A follow-up box lets you refine — "break that down by host", "only errors", "per minute instead" — without starting over.
AI charts need a configured model
Dynamic Charts with AI use the model set in LLM Configuration. The curated dashboards work regardless. For ad-hoc investigation over raw records, see the Log Browser, which also supports read-only SQL for power users.
Related
- Platform Intelligence — ask anything from the home console
- Log Browser & search
- LLM Configuration