Incidents & Root-Cause Analysis
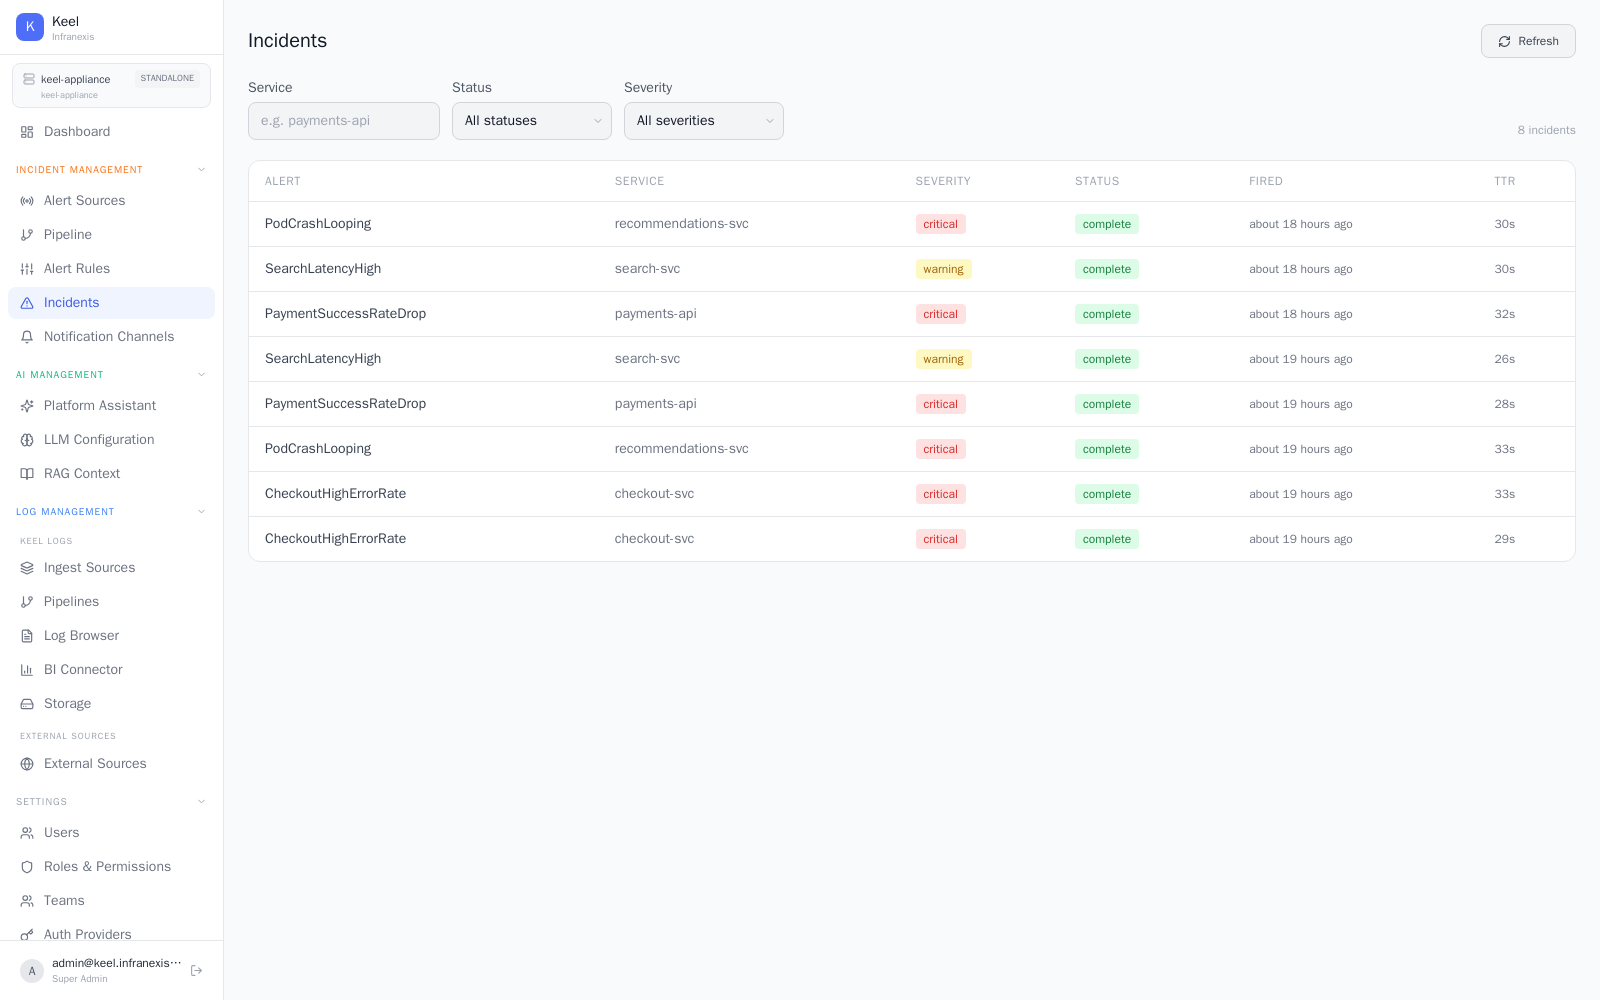
Location in Keel: /incidents
Incidents are created from incoming alerts routed through an alert pipeline or from detections firing on your own logs. Each incident automatically runs root-cause analysis against the configured LLM, and the Incidents page is where you triage, filter, and track them to resolution.
The incident list
| Column | What it shows |
|---|---|
| ALERT | The alert or detection that opened the incident. |
| SERVICE | The affected service. |
| HOST | The affected host (incidents are host-scoped). |
| SEVERITY | critical, high, warning, or info. |
| RCA | The state of root-cause analysis for this incident (see below). |
| FIRED | When the incident opened. |
| TTR | Time to resolve. |
RCA states
Root-cause analysis runs against the LLM you set in LLM Configuration. Each incident's RCA is in one of these states:
| State | Meaning |
|---|---|
generated |
RCA completed and is ready to read. |
generating… |
RCA is currently running. |
failed |
RCA could not complete. |
limit_exceeded |
An applicable limit was reached before RCA could complete. |
RCA runs against your configured model
Root-cause analysis uses the model backend you configure. With a local model, the analysis context stays on your network; with a hosted model, only the context for that request goes to the endpoint you configured. Configure the backend in LLM Configuration.
Filtering
Narrow the list with the filters across the top:
- Time range — defaults to All time.
- Service — filter by service (e.g.
payments-api). - Host — filter by host (e.g.
phost1). - RCA — filter by RCA state (
generated,generating…,failed,limit_exceeded, or all states). - Severity — filter by
critical,high,warning,info, or all severities.
Retention
Set Auto-delete after a number of days and click Save to age out old incidents automatically, so the list stays focused on what's current. Refresh reloads the list on demand.
Related
- Detections — self-detected conditions that open incidents
- Alert pipeline — routes incoming alerts into incidents
- LLM Configuration — the model that powers RCA
- Knowledge base — runbooks that ground RCA