BI Connector
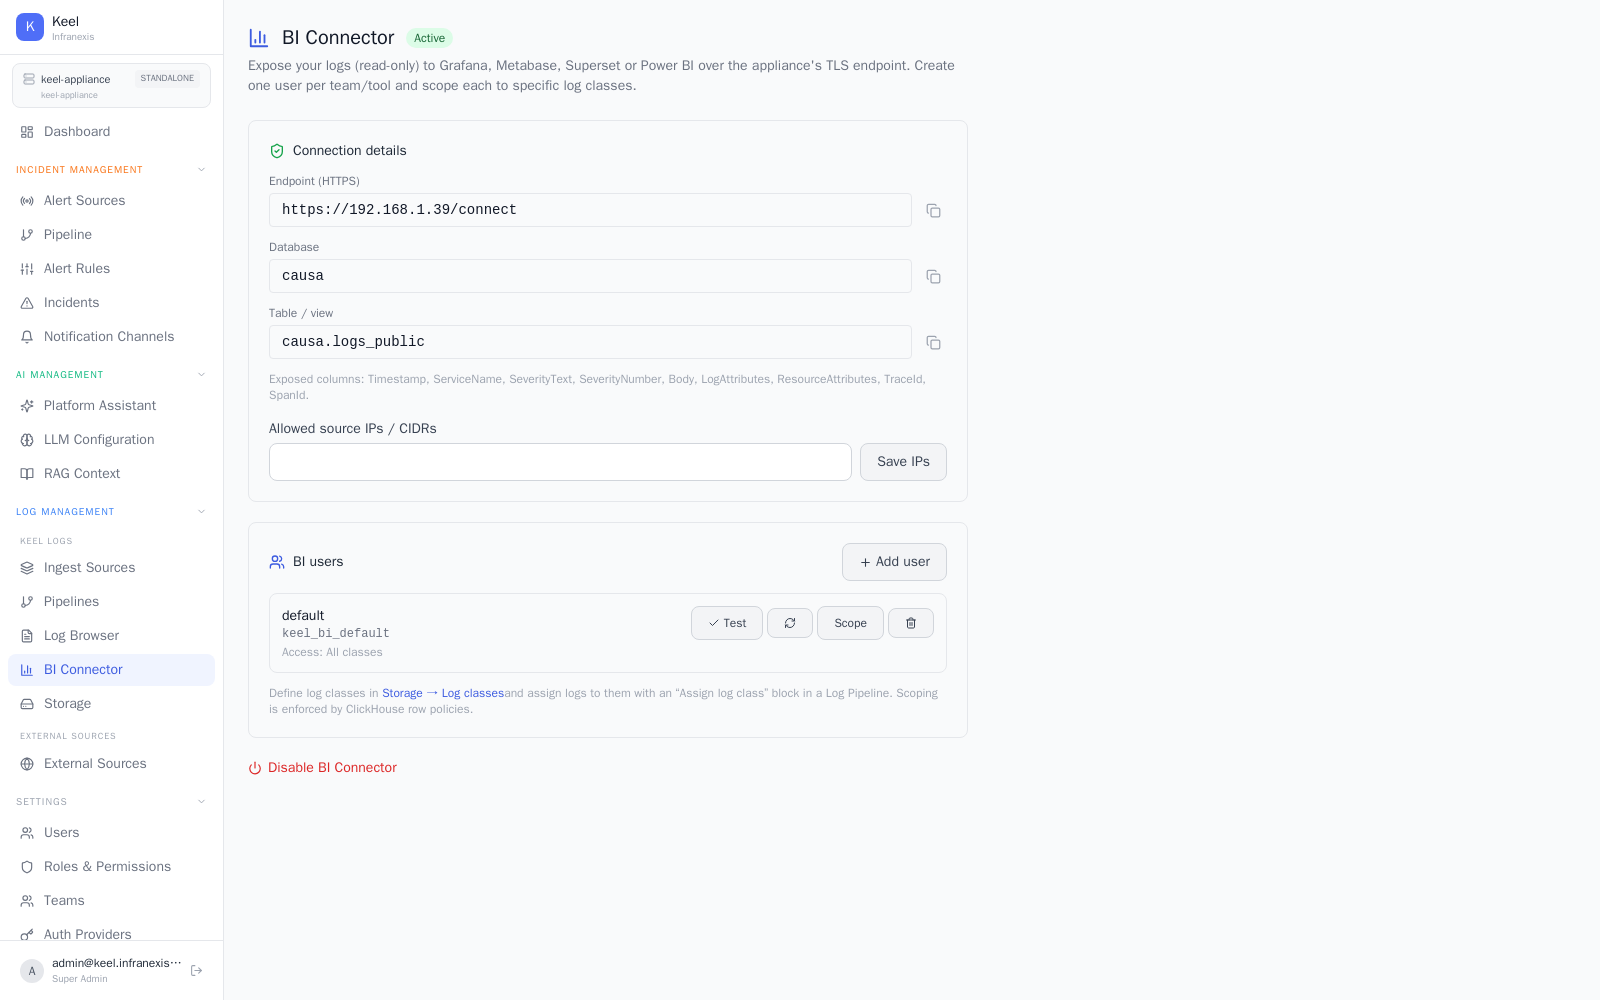
Location in Keel: /settings/bi-connector
The BI Connector exposes your logs read-only to external BI tools — Grafana, Metabase, Superset, or Power BI — over the appliance's TLS endpoint, using a ClickHouse-compatible SQL/HTTP protocol. Your BI tool queries the live log store in place: no export, no second copy.
Enabling it
The connector ships Disabled. Set the optional Allowed source IPs / CIDRs (recommended) to restrict which hosts may connect — for example 10.0.0.5, 192.168.1.0/24. Leaving it blank allows any host that has a valid password. Then click Enable BI Connector.
Create one user per team or tool and scope each to specific log classes, so a dashboard only ever sees the data it should.
Connecting Grafana
Add a ClickHouse data source in Grafana pointing at the connector's TLS endpoint, and authenticate with the dedicated user Keel issued. Metabase, Superset, and other ClickHouse-compatible clients connect the same way.
Example: Grafana dashboard
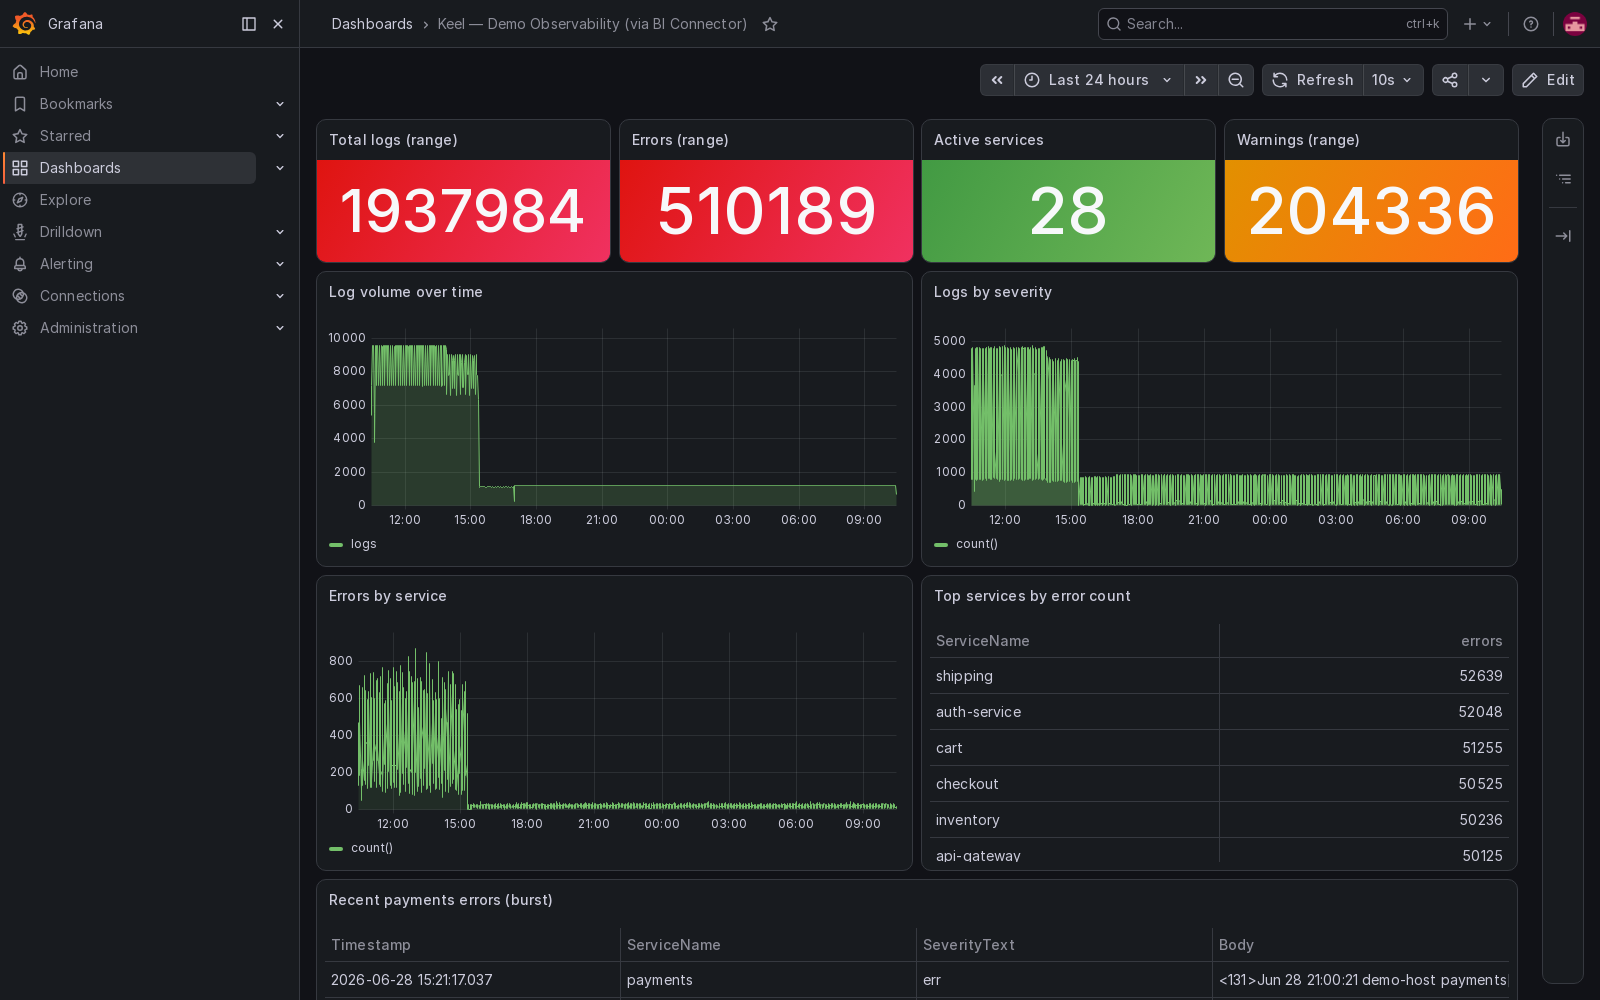
The dashboard below is built entirely on the BI Connector — log volume over time, errors and warnings, top services by error count, and recent error samples — end to end from Grafana through the connector to the Keel log store:
Notes
- Read-only. BI tools can query but never modify or delete your data.
- Dedicated users, rotatable credentials. Provision a separate read-only user per tool and rotate its credentials from this settings page.
- No copy leaves the appliance. Queries run against your live data on your own infrastructure — nothing is exported to Infranexis or any SaaS.
- For large queries, prefer aggregations; the log store is column-oriented and fast at them.
Related
- Log search & Log Browser — ad-hoc exploration inside Keel
- Explore & dashboards — built-in dashboards and Dynamic Charts
- Storage & retention — what data is available to query